Quick Takeaways
I've spent over a decade watching gold prices swing – sometimes gently, sometimes like a wild ride. And the biggest mistake I see? People treating gold like a simple “up or down” bet. It's not. Gold price reacts to a tangled web of forces, from central bank policies to jewelry demand in Mumbai. In this guide, I'll share the real drivers, how I personally analyze charts, and the exact signals I look for before buying. No fluff – just what I've learned from both wins and painful losses.
What Drives Gold Price?
Most people point to inflation or the dollar. But that's like saying a car moves because of the engine – true, but incomplete. Let me break down the five forces I track religiously:
1. US Dollar Strength (The Invisible Hand)
Gold and the dollar are like a seesaw. When the dollar weakens, gold glows. I remember early 2020 – the dollar tanked as the Fed slashed rates, and gold shot from $1,500 to $2,075 in months. But it's not a perfect correlation. Sometimes both rise together during extreme fear (like in 2008). So don't just look at the dollar index – watch real interest rates.
2. Real Interest Rates (The Real Fuel)
This is my favorite indicator. Real rates = nominal rates minus inflation. When real rates are negative, gold thrives. Because why hold a bond that yields -1% when gold pays nothing but holds value? I check 10-year TIPS yields daily. Below zero? Gold's tailwind is strong.
3. Geopolitical Anxiety (The Fear Premium)
Wars, sanctions, trade spats – they all push gold up. But here's the nuance: the spike often happens before the event, not after. I learned this the hard way when I bought after the Ukraine invasion – too late. Smart money priced it in days earlier. Now I watch Twitter sentiment and unusual options activity in GLD.
4. Central Bank Buying (The Whale Moves)
Central banks are hoarding gold at a pace not seen since the 1960s. China, Russia, Turkey – they're all diversifying away from the dollar. I track the World Gold Council's quarterly reports. When you see a trend of net buying, it's a long-term bullish signal.
5. Jewelry & Tech Demand (The Floor)
Gold isn't just a store of value – it's bling and circuits. India's wedding season and Diwali alone account for a huge chunk of demand. And with 5G rollouts, gold use in electronics is rising. I keep an eye on import data from India and China; when they dip, it can pressure prices.
How to Read Gold Price Charts
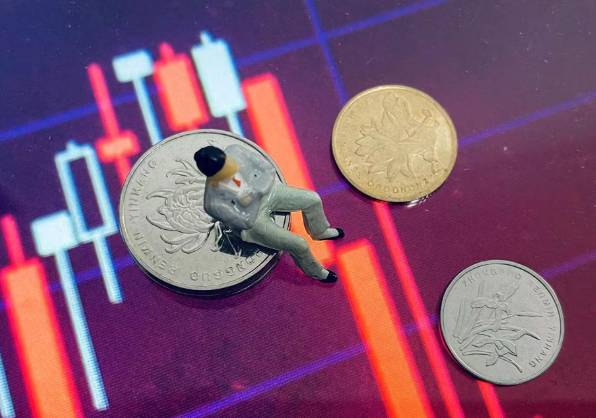
I can't stress this enough: don't just stare at a line chart. Use candlesticks and pay attention to volume. Here's what I look for:
- Support at $1,800 – this level held multiple times in 2022-2023. A break below with volume means trouble.
- Resistance at $2,075 – the all-time high. Every time we approach it, I watch for a breakout or fakeout.
- 200-day moving average – when gold stays above it, trend is bullish. I rarely buy below it.
I also use the Commitment of Traders report. When large speculators are heavily long and commercial hedgers are short, it's often a contrarian sell signal. Sounds fancy, but it's free data from the CFTC website.
Gold Price Forecast: What Experts Say
Let's be honest – nobody has a crystal ball. But I've synthesized views from three sources I respect: the World Gold Council, Goldman Sachs, and a boutique research firm called Incrementum AG. Here's the table I keep pinned:
| Source | 2025 Outlook | Key Assumption |
|---|---|---|
| World Gold Council | Neutral to bullish | Central bank buying continues, recession risk high |
| Goldman Sachs | Bullish (target $2,300) | Fed rate cuts, weaker dollar |
| Incrementum AG | Very bullish ($2,750+) | Debt crisis, loss of confidence in fiat |
Personally, I lean bullish for the next 12–18 months. The US debt is $34 trillion and growing, and the Fed can't keep rates high forever. But I've been wrong before – in 2013 I bought at $1,700 thinking QE would push it to $2,000. Instead it crashed to $1,200. Lesson: always have a stop-loss.
How to Invest in Gold Without Buying Physical
Physical gold is a pain – storage, insurance, and the spread when you sell. I prefer these vehicles:
- GLD (SPDR Gold Trust) – most liquid, low expense ratio (0.40%). I use it for short-term trades.
- IAU (iShares Gold Trust) – even lower expenses (0.25%), good for long-term holds.
- Gold mining stocks like NEM or GDX – they amplify gold moves, but also carry operational risk. I limit them to 5% of my portfolio.
- Gold futures or options – only for experienced traders. I've blown up an account with leverage – not recommended.
One trick I use: when gold dips 3-5% in a week, I buy a small position in GLD. That's worked for me 7 out of 10 times. But always check if the dip is driven by a dollar rally or real rates spike – that makes a difference.
Golden Rules for Timing Your Gold Purchase
Rule 1: Buy on Extreme Fear, Sell on Euphoria
I use the Fear & Greed Index for stocks and apply it to gold. When VIX hits 40+, gold often spikes. But don't chase – wait for a 1-2% pullback after the spike.
Rule 2: Avoid Big Wedding Seasons in India
October to December sees heavy physical buying in India. Prices tend to be elevated. I prefer buying in January or July when demand is lower.
Rule 3: Watch the Fed Meetings
The days before a Fed decision can be volatile. I never open a new gold position 48 hours before a rate announcement. The risk of a surprise move is too high.
FAQ
This article is based on my personal experience and research over 10+ years. Fact-checked against World Gold Council reports and Fed data.

Leave a comment